May 13, 2026
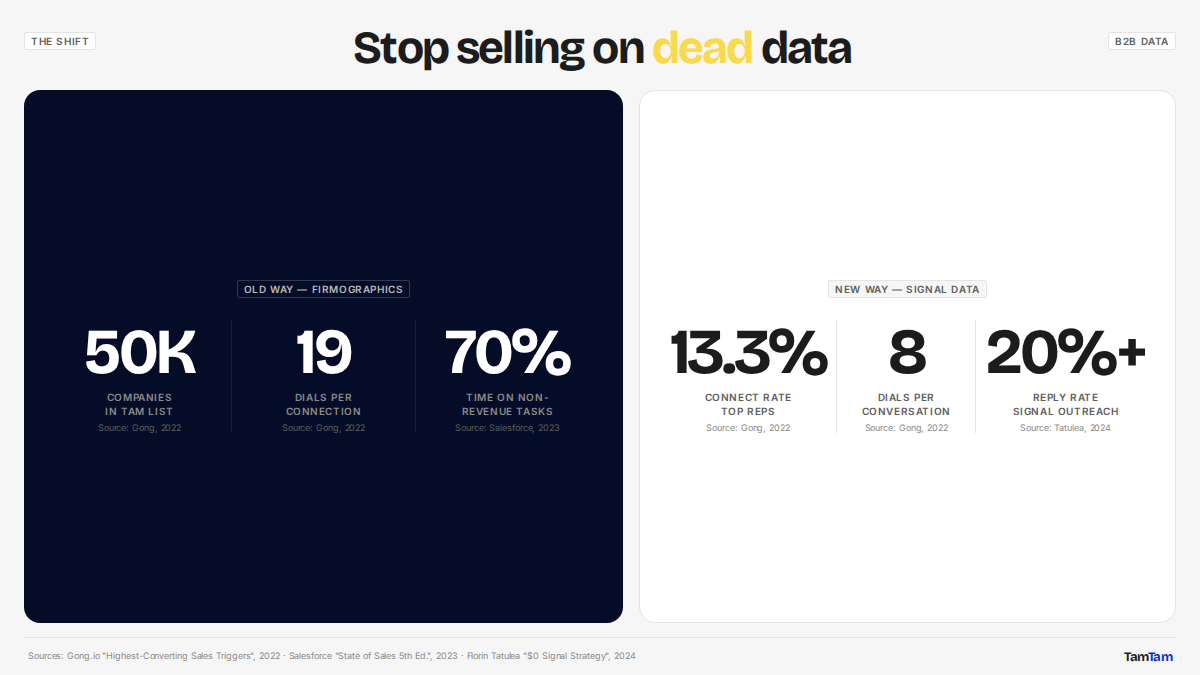
Firmographic data like industry and company size defines your TAM but is a poor trigger for outreach because it contains no buying intent. To find actual buyers, sales teams must layer on technographics, intent data, and chronographics (signals) to understand timing and context. The modern sales playbook uses this static data for disqualification and dynamic signals to trigger highly relevant, timely outreach.
Let’s talk about Sarah.
Sarah is a new SDR, bright-eyed and ready to crush her quota. On her first day, her manager hands her a login to a data provider and a single instruction: “Build a list.”
So she does. She pulls up the filters:
The tool spits back a list of 50,000 companies. Fifty thousand. Sarah feels a rush. Look at all this opportunity! This is going to be easy.
Week one, she hammers the phones and sends 500 templated emails. Activity is high. Her manager is pleased. She books two meetings. Not bad.
Week four, the templates feel stale. The list feels endless. She’s had the same "not interested" conversation 100 times. She’s booked five meetings total. The rush is gone, replaced by a dull dread.
Week twelve, Sarah is a husk. Her soul has been chipped away by a thousand unanswered dials and a hundred curt rejections. She’s learned that her massive list of 50,000 companies contains maybe, maybe, a few hundred that could ever possibly care about her product right now. The other 49,800? They're just noise.
Sarah is fictional, but her story is real. It’s the story of what happens when a sales org becomes addicted to the heroin of B2B sales: firmographic data.
It gives you the cheap, immediate high of a massive TAM that looks great on a slide deck, but it rots your sales floor from the inside out. It burns out your best people by forcing them to search for a needle in a continent-sized haystack.
The truth is, all B2B data is not created equal. There's a hierarchy, and understanding it is the difference between building a high-precision sales engine and a soul-crushing activity machine.
Let’s break it down.
This is the most basic layer. It answers the question: "Who is this company?"
Firmographic data describes the fixed, objective characteristics of a business. Think of it as a company's census data. Common fields include:
Who it's best for: Literally everyone, but only as a starting point. It's the raw material you need to define the absolute boundaries of your market.
Strengths:
Weaknesses:
Verdict: Firmographics are the foundation of your house. You absolutely need them, but if you try to live in the foundation, you’re going to have a miserable time.
This layer answers the question: "What technology does this company use?"
Technographic data is a catalog of a company’s tech stack: the hardware and software they’ve bought, built, or integrated. It includes everything from their CRM and marketing automation platform to their cloud hosting provider and analytics tools.
Who it's best for: Any company whose product competes with, integrates into, or is enhanced by another technology. If you sell a Salesforce plugin, you damn well better know who uses Salesforce.
Strengths:
Weaknesses:
Verdict: Technographics add a much-needed layer of color. You're no longer just looking at a company's size; you're looking under the hood at its engine. It’s a huge step up, but it's still missing the spark.
This is where things get interesting. Intent data tries to answer the question: "What is this company actively researching?"
Providers track the digital footprints of companies across the web. They monitor which articles are being read, which whitepapers are downloaded, and which competitor sites are being visited. The idea is to capture the signals of a buyer's journey as it happens.
Who it's best for: Sales and marketing teams who want to move from a purely outbound motion to capturing active demand. It helps you find the people who are already looking for a solution like yours.
Strengths:
Weaknesses:
Verdict: Intent data is a game-changer, but it’s not a silver bullet. It gets you into the right ballpark at the right time, but it often leaves you guessing which player is up to bat.
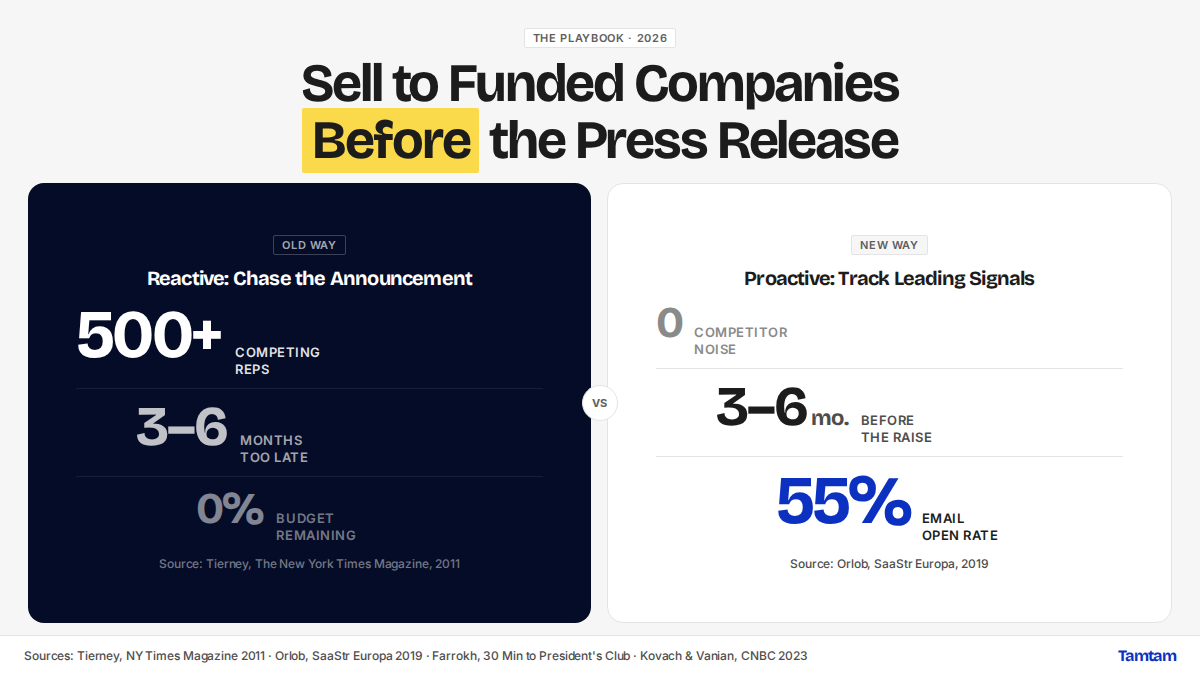
This is the top of the pyramid. Chronographic data, more commonly called "signals" or "trigger events," answers the only question that truly matters: "Why should I reach out right now?"
Signals are specific, observable events happening at a company that indicate an opportune moment to engage. Unlike vague intent, signals are concrete.
Examples include:
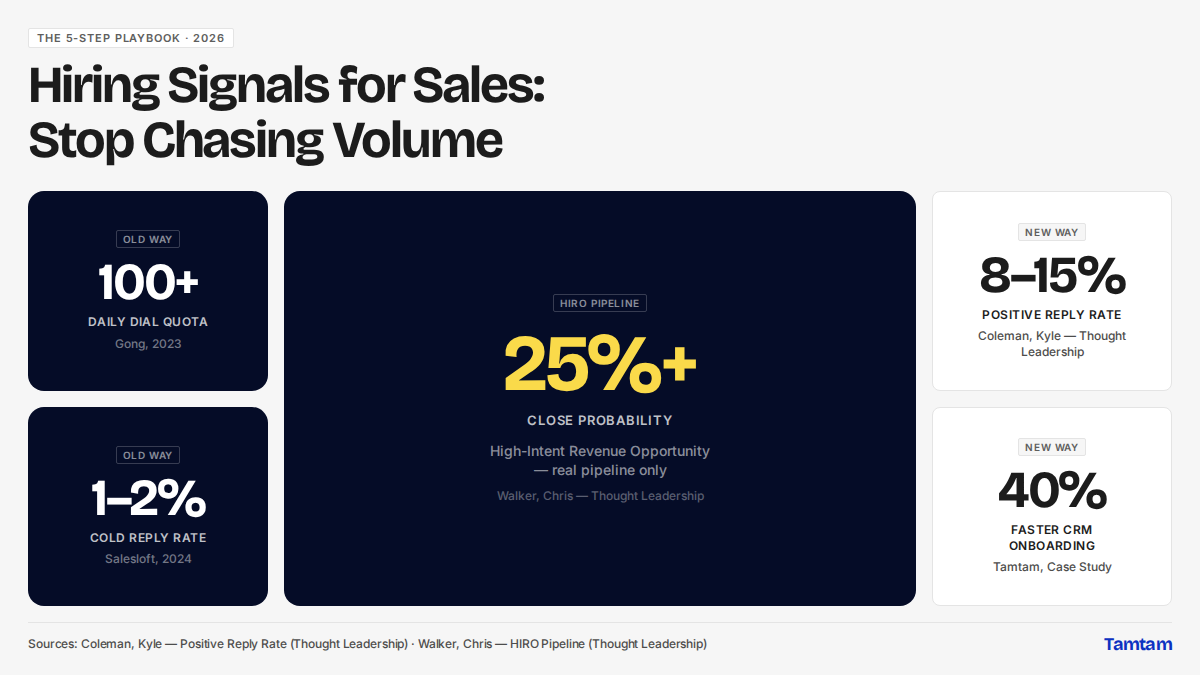
Who it's best for: Elite GTM teams who are obsessed with efficiency, relevance, and conversion rates. This is for teams who would rather have 10 hyper-relevant conversations than 1,000 generic ones.
Strengths:
Weaknesses:
Verdict: This is it. This is the highest leverage data in all of B2B sales. Signal-based selling is the single biggest unlock for turning a struggling sales team into a powerhouse. As Florin Tatulea has shown, a simple "$0 Signal Strategy" using nothing but a professional network and manual tracking can consistently get over 20% reply rates on a small set of accounts. The challenge is doing that at scale, across thousands of accounts, every week.
| Data Type | The Question It Answers | Primary Use Case | Fatal Flaw | Example Fields |
|---|---|---|---|---|
| Firmographic | Who are they? | TAM definition, territory planning | Completely static, no buying intent | Industry, Headcount, Revenue, Location |
| Technographic | What do they use? | Message tailoring, technical qualification | Still lacks timing, can be misleading | CRM, ERP, Cloud Provider, Marketing Auto. |
| Intent | What are they researching? | Demand capture, prioritizing accounts | Often anonymous, misses the "dark funnel" | Topic surges, Competitor research |
| Chronographic | What's happening right now? | Triggering timely, relevant outreach | Requires a fast, systematic process | New exec hire, Funding, Job postings, M&A |
Here’s the secret: you don't choose one type of data. You layer them, intelligently, to create a system that filters out noise and surfaces opportunity.
Think of it like this:
Your first job is not to find leads; it's to eliminate non-leads. Use Firmographics and Technographics as aggressive negative filters.
Build a fence around your market. Who absolutely cannot buy your product?
Be ruthless. Your goal here is to shrink the universe. You want the smallest possible pond that still contains all your ideal fish. Don't worry about "missing someone." Worry about your reps drowning in a sea of irrelevance.
Now that you have your fenced-in pond of qualified accounts, use Intent Data to see where the fish are starting to gather. Which accounts are showing ripples of interest?
This is your watch list. These are the accounts to add to nurturing campaigns, to start following on social media, and to do some light, pre-emptive research on. You're not striking yet; you're just getting ready. You're watching the water for the right moment.
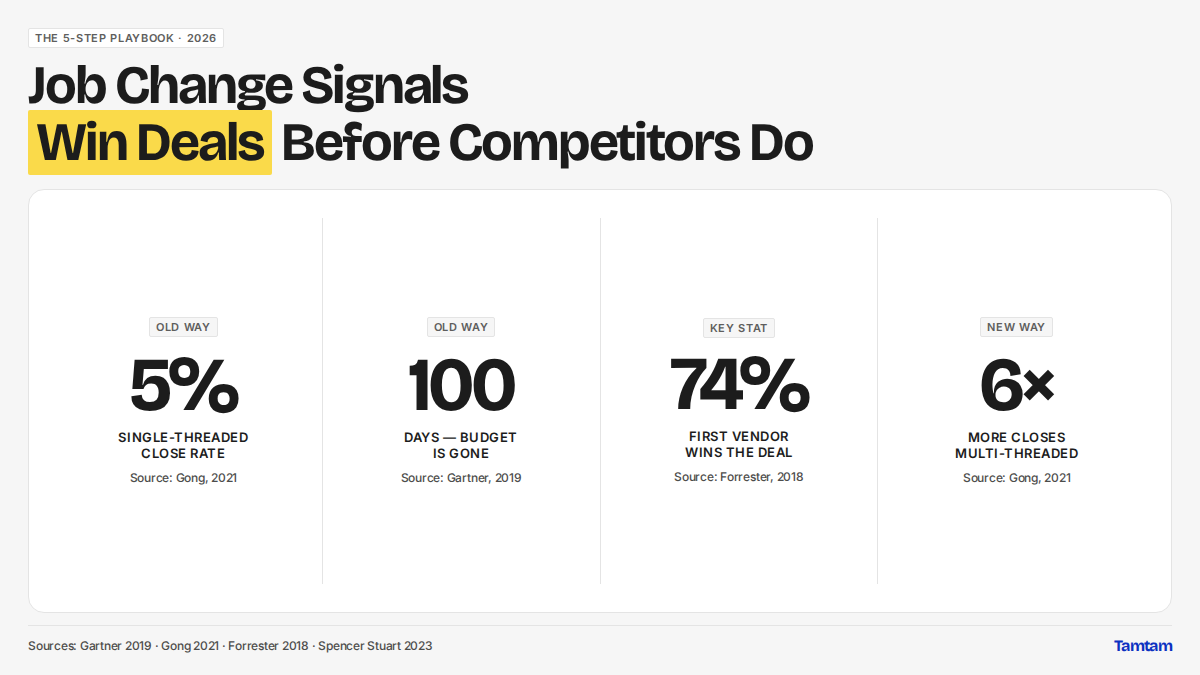
This is the moment of truth. Use Chronographic Signals as your positive triggers for direct action.
The second a prioritized account inside your fence has a key event (a new VP of Sales starts, they post a job for a Director of Demand Gen, they announce a new product), you strike.
This is your "why now." This is your reason to call, your reason to email, your reason to connect on a professional network. Your message isn't a cold pitch; it's a timely, relevant, and helpful piece of communication tied to a real event in their world. This is how you book meetings.
Knowing the layers is one thing. Turning them into a clean, ready-to-work list is another. Here's the rest of the playbook:
Stop lying to yourself. Stop buying massive, dead lists and celebrating "activity" metrics that lead nowhere. Your reps are burning out, your messaging is being ignored, and your competition is getting smarter. The strategy is to filter with static data and engage with dynamic signals. The old playbook of brute-force volume is a guaranteed path to mediocrity. To win, you have to build a system that layers data intelligently, listens for the right signals, and empowers your team to act at the moment of maximum leverage. That's exactly what Tamtam is built for. We analyze your past won deals to learn the buying triggers specific to your offering, then continuously research every account in your TAM against those triggers. Verified contacts, the angle to use, delivered to your CRM every morning.
Set up for you before our first call
Book a demo